What is Phylogeny?
Phylogeny are a way of tracking evolutionary history over time. Understanding the evolutionary history of a particular gene, protein, or pathway can be useful for researchers because it can help reveal novel functions in different organisms or show that it has been highly conserved over time. Below is an example of a phylogenetic tree with the important components labeled. A clade is a group of all of the descendants of a single common ancestor. A speciation event is denoted by a node. The root of the tree is the most recent common ancestor of the entire tree. Branches represent evolutionary distance.[1]
How are phylogeny built?
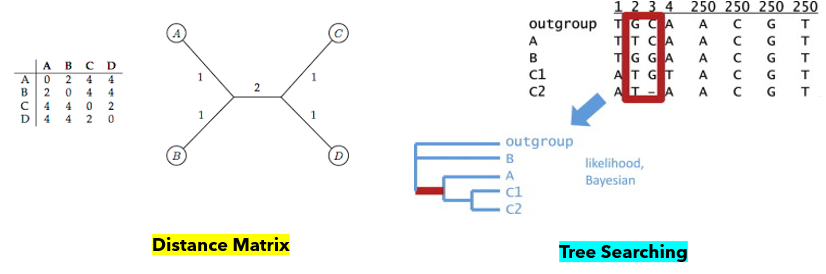
Phylogenetic trees are built in a few step process that begins with gathering the sequencing data that you are interested in analyzing. Once that data has been compiled, the sequences are aligned using an algorithm in a program, such as ClustalX. These programs analyze sequences using a roughly constructed guide tree to determine the sequence addition order, adding the most alike sequences together. Finally, a tree is made using one of two methods: distance matrix or tree searching. The distance matrix method involves constructing a matrix of the distance (essentially the percent difference) between each sequence and building the tree by putting more alike sequences closer on the tree. The tree searching method analyzes each column of the alignment and creates a tree based on maximum likelihood and parsimony. Parsimony is minimizing the number of mutation events that would explain the current tree. The distance matrix method is faster, but does not yield as much information as the tree searching method.[1][2]
Phylogenomic analysis of FERmt1
In order to analyze FERMT1, the sequence of the gene in 6 different organisms was compiled. The raw sequencing data can be downloaded below. This data was aligned in MEGA, and a tree was constructed using a tree searching method, maximum likelihood. Bootstrapping analysis revealed statistically acceptable scores for the alignments, except for alignments involving Brachypodium distachyon, which was included as a severe outgroup, so this was not unexpected. A maximum parsimony tree was also constructed that showed a slightly different relationship than the maximum likelihood tree. Bootstrapping testing for this tree was also generally reliable.
| fermt1_backup.txt |
Maximum Likelihood Tree
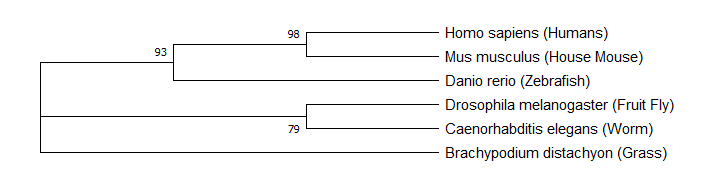
Figure 1: Maximum likelihood tree constructed from FERMT1 sequencing data (or FERMT1 homologs) for Homo sapiens, Mus musculus, Danio rerio, Drosophila melanogaster, Caenorhabditis elegans, and Brachypodium distachyon.
Maximum Parsimony Tree
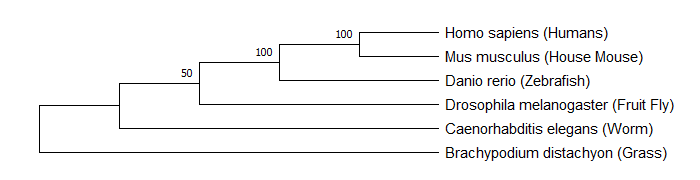
Figure 2: Maximum parsimony tree constructed from FERMT1 sequencing data (or FERMT1 homologs) for Homo sapiens, Mus musculus, Danio rerio, Drosophila melanogaster, Caenorhabditis elegans, and Brachypodium distachyon.
Discussion
The maximum likelihood tree and maximum parsimony tree revealed that the mouse FERMT1 gene is most closely related to human, followed by zebrafish. This indicates that FERMT1 in these species is most similar to the human homolog. It helps provide an explanation for mice and zebrafish with FERMT1 mutations showing similar phenotypes to humans with Kindler syndrome. These results also indicate that FERMT1 is more similar in organisms with more similar external cellular makeups.
References
Header Image: www.shutterstock.com/search/human+evolution
Image 1: www.ncbi.nlm.nih.gov/Class/NAWBIS/Modules/Phylogenetics/phylo7.html
Image 2: Adapted from both https://fuzzyatelin.github.io/bioanth-stats/module-24/module-24.html
https://www.researchgate.net/figure/Crinoid-molecular-phylogeny-Heuristic-search-tree-found-under-the-best-fitting-maximum_fig1_225162792
1. Baldauf, Sandra L. “Phylogeny for the Faint of Heart: a Tutorial.” (June 2003). Trends in Genetics.
2. Delsuc, Frédéric, et al. “Phylogenomics and the Reconstruction of the Tree of Life.” (May 1st, 2005). Nature Reviews Genetics.
This web page was produced as an assignment for Genetics 564, an undergraduate capstone course at UW-Madison."
