Transcriptomics
What is transcriptomics?
The central dogma of biology is that DNA makes RNA which makes protein. Each of these steps can provide information for researchers that allows them to understand biological pathways better. Transcriptomics is one way that scientists can investigate the central dogma by analyzing the RNA that an organism produces or its transcriptome. Understanding what genes are produced in a cell at a point in time provides potential insights into gene function, regulation, and other parts of an organism's biology.[1]
How are transcripts studied?
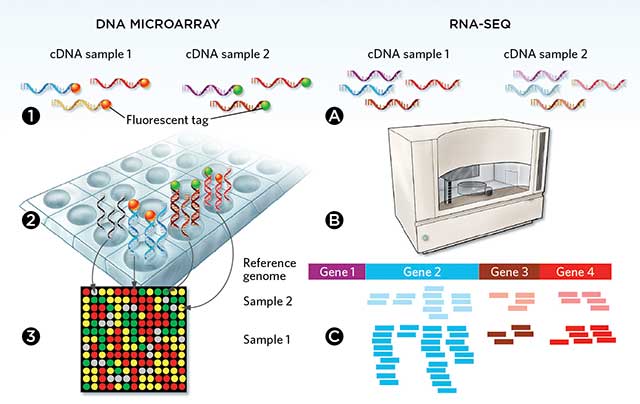
Transcriptomics is studied in one of two main ways: microarray analysis and RNA-Sequencing (RNA-Seq). Both approaches work by extracting RNA from a sample and converting it to complementary DNA (cDNA). Microarrays use cDNA with fluorescent tags attached, and the cDNA hybridizes with the DNA in the array. Fluorescence is measured in each well to gather expression levels. RNA-Seq functions by sequencing the cDNA and mapping the reads.[3] Microarrays are the older, traditionally used technique. However, RNA-Seq allows for sequencing of the entire transcriptome while microarrays only detect predetermined transcripts. RNA-Seq provides vastly more information than microarrays, but this results in more computing power and intense bioinformatic approaches being required for analysis of the data.[2]
FERMt1 Transcriptomic testing
Expression levels of FERMT1 are highest in endocrine tissues, proximal digestive tract and GI tract. It seems that protein expression is fairly high among most tissues despite varying levels of RNA expression. Apart from mucosal symptoms in the GI tract, the primary symptoms of Kindler Syndrome occur in the skin, which shows moderate expression of FERMT1.
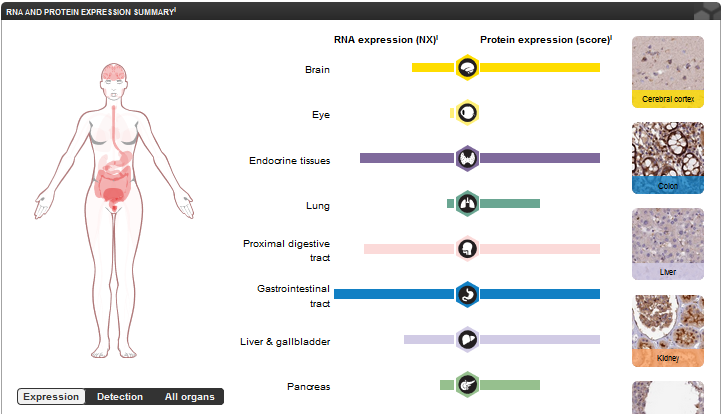
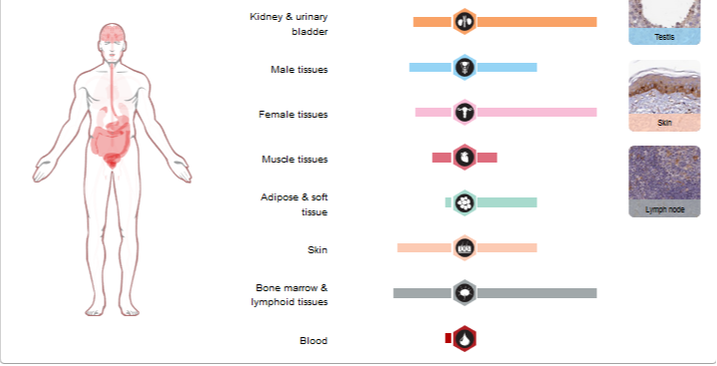
Figure 1: The RNA and protein expression levels of FERMT1 in several different tissues of the body. Data obtained from https://www.proteinatlas.org/ENSG00000101311-FERMT1/tissue.
RNA expression levels in tissues
RNA expression levels of FERMT1 are highest in the rectum and notably high in the adrenal gland, esophagus, tongue, and colon. Skin cells show a moderate expression level of the gene.
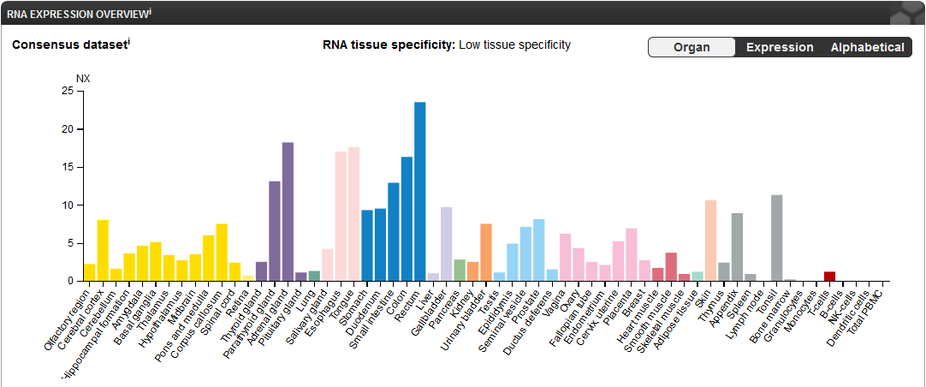
Figure 2: FERMT1 expression levels per tissue. Data obtained from https://www.proteinatlas.org/ENSG00000101311-FERMT1/tissue.
Discussion
The transcriptomic analysis of FERMT1 revealed noticeably high expression levels of the gene in GI tract, and proximal digestive tract tissues. However, it showed only moderate expression of FERMT1 in skin tissue. This demonstrates the importance of FERMT1 in development of mucosal symptoms, but fails to account for the skin blistering, UV sensitivity, and several other phenotypes associated with Kindler Syndrome. These results could indicate why mucosal symptoms tend to last longer in Kindler Syndrome patients versus the skin blistering phenotype.[4]
REFERENCES
Header Image: http://heatmapper.ca/
Image 1: https://www.the-scientist.com/lab-tools/an-array-of-options-35381
1. Lowe, Rohan, et al. “Transcriptomics Technologies.” PLOS Computational Biology. May 18th, 2017.
2. Rao, Mohan S., et al. “Comparison of RNA-Seq and Microarray Gene Expression Platforms for the Toxicogenomic Evaluation of Liver From Short-Term Rat Toxicity Studies.” Frontiers in Genetics. January 22nd, 2019.
3. Yandell, Kate. “An Array of Options.” (May 31st, 2015). The Scientist Magazine, Retrieved 5/9/2020 from www.the-scientist.com/lab-tools/an-array-of-options-35381.
4. Kindler Syndrome. (2020, January 21st). Retrieved February 4th, 2020, from https://ghr.nlm.nih.gov/condition/kindler-syndrome.
This web page was produced as an assignment for Genetics 564, an undergraduate capstone course at UW-Madison."
